Computing heritability
Computing heritability.
We will use the simulated gryphon dataset (download zip file ).
We need to load both the phenotypic data gryphon.csv and the pedigree gryphonped.csv.
phenotypicdata <- read.csv("data/gryphon.csv")
pedigreedata <- read.csv("data/gryphonped.csv")
The phenotypic data look like this:
head(phenotypicdata)
##     id mother cohort sex birth_weight tarsus_length
## 1 1029   1145    968   1        10.77         24.77
## 2 1299    811    968   1         9.30         22.46
## 3  643    642    970   2         3.98         12.89
## 4 1183   1186    970   1         5.39         20.47
## 5 1238   1237    970   2        12.12            NA
## 6  891    895    970   1           NA            NA
We will use birth_weight as a response variable.
And the pedigree looks like this:
head(pedigreedata)
##     id mother father
## 1 1306     NA     NA
## 2 1304     NA     NA
## 3 1298     NA     NA
## 4 1293     NA     NA
## 5 1290     NA     NA
## 6 1288     NA     NA
tail(pedigreedata)
##       id mother father
## 1304 127    917     NA
## 1305 117    550     NA
## 1306  95     29     NA
## 1307 158    689     NA
## 1308 131   1223     NA
## 1309 144   1222     NA
Here is the simplest implementation of an animal model in MCMCglmm.
First, we load the package:
library(MCMCglmm)
Second, while not strictly necessary we think it is a good practice to convert the pedigree to an inverse-relatedness matrix. If the pedigree is properly formatted this is easily done with MCMCglmm::inverseA. The other option is to pass the pedigree directly in the pedigree argument of the function MCMCglmm, but that solution is less flexible.
inverseAmatrix <- inverseA(pedigree = pedigreedata)$Ainv
Now we can fit the model of birth_weight to estimate three parameters:
id column)model1.1 <- MCMCglmm(birth_weight ~ 1, #Response and Fixed effect formula
random = ~id, # Random effect formula
ginverse = list(id = inverseAmatrix), # correlations among random effect levels (here breeding values)
data = phenotypicdata)# data set
Note the use of the argument ginverse to link the elements of the relatedness matrix to the individual identity in the phenotypic data.
Let’s look at the results.
It is always a good idea to look at the trace of the MCMC sampling. Ideally we want to see “hairy caterpillars” for each parameter, that is, a stationary distribution without long-term or short-term trends across iterations. This lack of trend would indicate that the model may have converged and may have explored properly the multivariate parameter space, thus giving us reliable parameter estimates.
plot(model1.1, density=FALSE)
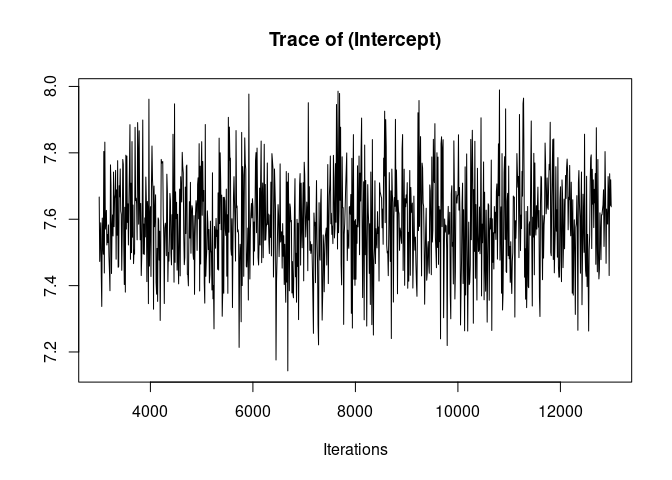
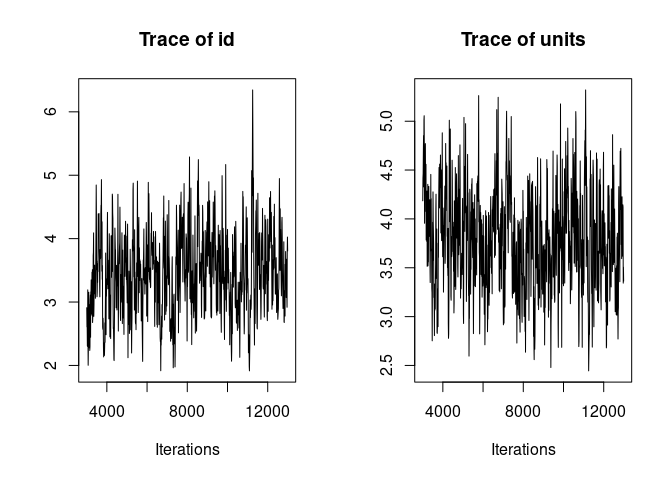
Here the traces of the random effect variance id and of the residual variance are not bad but show an initial trend as well as some fluctuations. We are going to re-run the model for longer to avoid those problems before we look at the results.
We do that by increasing the burnin value from 3000 to 10000 (this is the number of samples we discard at the beginning of the chain to remove the influence of random starting parameter values), the nitt value from 13000 to 30000 (this is the total number of samples), and the thin value from 10 to 20 (this is the interval between samples that are saved in the model output; thinning is used to reduce the memory used by the model, much of which would be made of redundant if all samples were saved because of auto-correlation in MCMC.)
model1.2 <- MCMCglmm(birth_weight ~ 1, #Response and Fixed effect formula
                   random = ~id, # Random effect formula
          ginverse = list(id = inverseAmatrix), # correlations among random effect levels (here breeding values)
          data = phenotypicdata, # data set
          burnin = 10000, nitt = 30000, thin = 20) # run the model for longer compare to the default
plot(model1.2, density=FALSE)
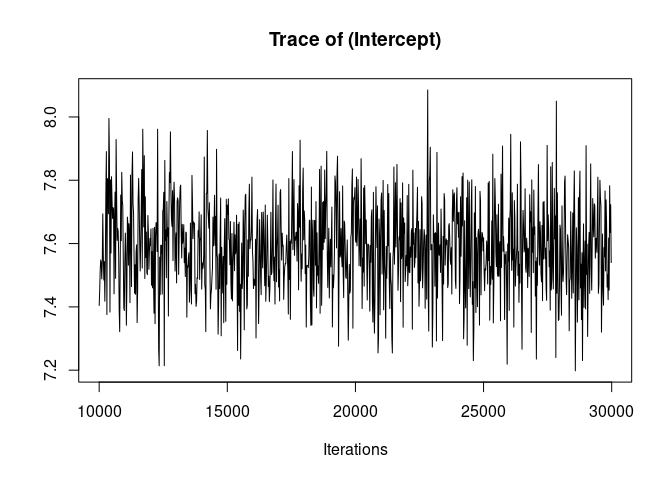
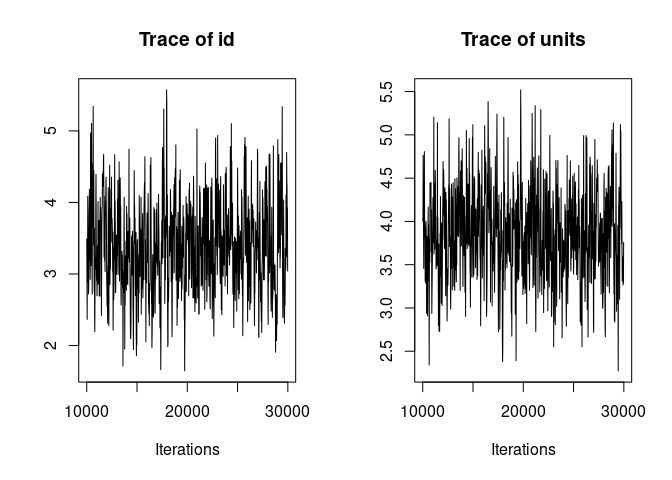
Much better. Now we can look at the model summary.
summary(model1.2)
##
##  Iterations = 10001:29981
##  Thinning interval  = 20
##  Sample size  = 1000
##
##  DIC: 3913.556
##
##  G-structure:  ~id
##
##    post.mean l-95% CI u-95% CI eff.samp
## id     3.381    2.248    4.699    381.5
##
##  R-structure:  ~units
##
##       post.mean l-95% CI u-95% CI eff.samp
## units     3.851     2.79    4.847    419.9
##
##  Location effects: birth_weight ~ 1
##
##             post.mean l-95% CI u-95% CI eff.samp  pMCMC
## (Intercept)     7.588    7.292    7.845    885.4 <0.001 ***
## ---
## Signif. codes:  0 '***' 0.001 '**' 0.01 '*' 0.05 '.' 0.1 ' ' 1
Among other things, the summary gives the posterior mean and 95% credible intervals for the intercept, the residual variance and the additive genetic variance.
The posterior mean is often not a great point estimate for variance parameters, because of the skew in their posterior distribution. We can obtain the posterior mode or posterior median of the additive genetic variance as
posterior.mode(model1.2$VCV[, "id"])
##     var1
## 3.252129
median(model1.2$VCV[, "id"])
## [1] 3.379763
We can get the 95% credible interval of the additive genetic variance as
HPDinterval(model1.2$VCV[, "id"])
##         lower    upper
## var1 2.247847 4.699142
## attr(,"Probability")
## [1] 0.95
Computing heritability.
Adding fixed and random effects.
Was this page helpful?
Glad to hear it! Please tell us how we can improve.
Sorry to hear that. Please tell us how we can improve.